Choosing speed limits for a country is a balancing act based on a number of competing pressures related to road design, accident rate and fuel economy. This article outlines some factors that are directly considered when designing roads, some that are indirectly considered and some which are consequences of a higher speed limit.
Accident rate
Globally there’s a trend towards lower speed limits as the growth in traffic numbers increases the probability drivers will be involved in head-on crashes, and the rise in distracting technology such as mobile phones causes more traffic incidents.
Slower speeds tend to result in less injury and death, although it doesn’t necessarily reduce the overall accident rate. This is simple physics: at lower speeds, the impact forces are less.
Two vehicles crashing head on at 130km/h is a 260km/h crash, whereas if vehicle speeds are reduced to 90km/h, the combined speed is only 180km/h.
In urban

Fuel economy
Fuel consumption increases rapidly above 80km/
Vehicle manufacturers make their vehicles to operate with the best fuel economy at around 80km/h, while electric vehicles have their best economy at around 40km/h.
Road construction
Faster traffic means more wear and tear on the road, especially when heavy vehicles are driving on it. Building roads for lower maximum speeds is much cheaper.
Roads are also imperfect surfaces; they have bumps, dips and undulations. At high speeds these can affect the trajectory of the vehicle.
Road design
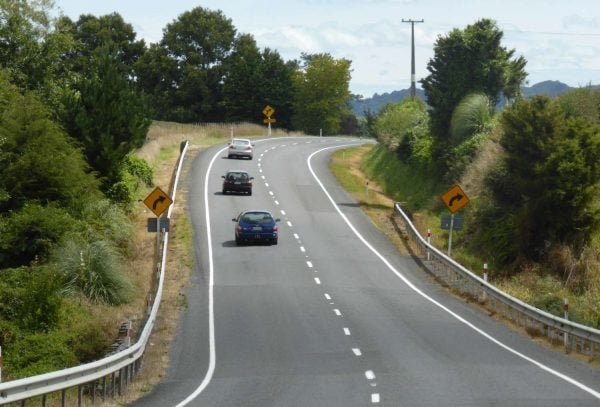
Roads have to follow the contours of the land and that means they have corners. Drivers need to be able to see a certain distance ahead to obstacles to ensure that they can stop safely. The faster you travel, the fewer seconds ahead you can see. This could lead to scenarios where motorists arrive at a situation around a corner which they are unable to brake for.
Tyre construction
The faster a vehicle travels, the better its tyres need to be in order to dissipate heat and disperse water. Travelling at higher speeds causes much higher tyre degradation. On surfaces with standing water, it’s much easier to hydroplane at higher speeds, therefore road drainage has to be much better on roads with higher speed limits.
Tyres also contribute to braking performance and road holding. If braking performance and grip on the road had to be better due to increased speed, this would mean the tyres would have to be softer, leading to increased wear, or the road surface would need to have more friction, e.g. similar to the surface placed in front of many pedestrian crossings.
Road authorities don’t want the extra cost of this high-friction surface and they also take into consideration safe cornering g-forces (more about this below).
Vehicle wear and tear
Vehicle suspension suffers much more at higher speeds as imperfections in the road give it a beating. Engines wear out more quickly and all components within the vehicle suffer more vibration leading to a shorter life. While this isn’t a factor in how speed limits are set, it is a consequence of higher speed limits.
A temporary speed limit might be placed on a road if it is particularly damaged due to flooding or it’s unable to be maintained.
Speed-limited traffic

Some traffic, such as agricultural vehicles and mopeds, can’t travel very fast due to limitations in their design or engine capacity. Having a high differential between general road traffic and slower road traffic increases danger. There are also other road users such as pedestrians and cyclists that will be affected. Cyclists will be affected by the slipstream of passing large vehicles.
Other road users
The proximity to schools (meaning slow bus traffic and young pedestrians), or aged care facilities (meaning road users with limited mobility and poor eyesight), means a lower limit might be set.
Personal ability
Some drivers don’t feel comfortable travelling at 100km/h and, instead, travel at 80km/h on the open road. Increasing the overall speed limit may intimidate these drivers more, causing them to slow down even more.
Traffic flows best in moderate to high densities when everyone is doing the same speed. If a speed survey indicates that road users are never meeting a certain speed then, theoretically, there would be little opposition to making that speed the reality.
Reaction times
The speed limit strikes a balance between expeditious travel and sensible limits that allow a driver to brake to a stop (or at least, close to a stop) if an emergency situation unfolds ahead. Braking distance is reaction time plus braking time. The faster you drive, the more distance you travel before you even hit the brake.
Noise
The faster vehicles
Signage
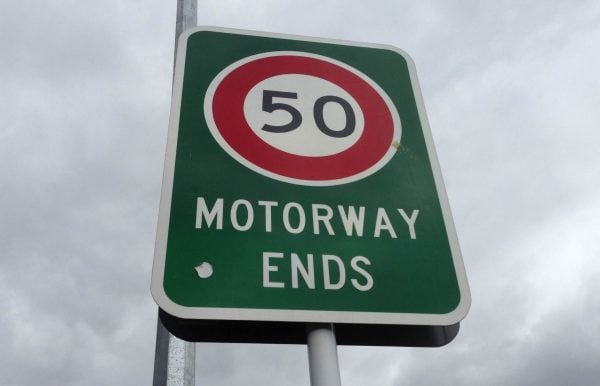
Speed limits should be understandable on signage. Having odd limits, like 104 or 53 are not standardised, easy to remember or easy to interpret on signs. All publicly signposted speed limits end in zero on New Zealand’s roads (although some vehicles are restricted to less than the signposted figure); some countries that operate in miles per hour have limits ending in five or zero.
Advisory speeds
On many corners, you’ll see a yellow sign with an advisory speed limit. This is the speed at which 0.22g is generated travelling around the corner. It’s used by drivers to help them determine a safe speed to travel around the corner. If the speed limit was more – say, 130km/h – many more of these advisory limit signs and chevrons would need to be installed because many corners that don’t register 0.22g at 100km/h would at 110km/h and above.
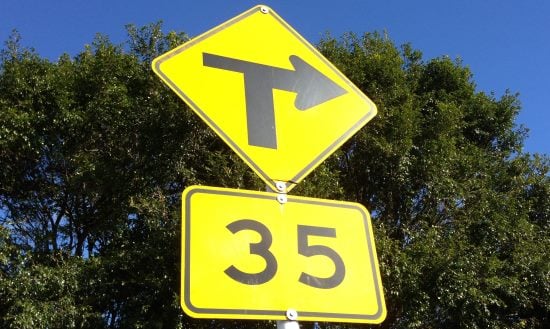
This would create an additional cost for sign installation and maintenance.
Is consultation ever used?
NZTA and Auckland Transport both say that they use consultation and feedback. However, this public consultation appears (to the public) like it is token and that public opinions are never considered. I.e. the agencies have already decided the speed limit will either change or stay the same, and they are going through the motions.
The legal process of changing a speed limit includes a formal consultation step, so it can’t be missed, but it doesn’t need to be considered. During the process, they ask if the public and stakeholders have any additional information that should be considered. This could be things like evidence of accidents or near misses, difficulties getting into or out of driveways, congestion at certain times of the day, difficulties crossing the road, issues with noise and pollution, etc.
Once the speed limits are decided, information is published and signage is changed.

Darren has written over 3000 articles about driving and vehicles, plus almost 500 vehicle reviews and numerous driving courses. Connect with him on LinkedIn by clicking the name above